![]()
![]()
![]()
Reading: Chapter 5 sections 5-8, 10.
Requires assumptions about
![]() s. Usual assumptions:
s. Usual assumptions:
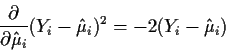
Remember: we already have assumed
![]() .
.
Notes:
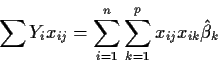
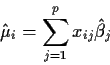
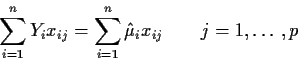
Choose ![]() to make fitted values
to make fitted values
![]() as
close to Ys as possible. There are many possible choices for ``close'':
as
close to Ys as possible. There are many possible choices for ``close'':
WE DO LS = least squares.
To minimize
![]() take derivatives with respect to each
take derivatives with respect to each
![]() and set them
equal to 0:
and set them
equal to 0:
![\begin{align*}\frac{\partial}{\partial\hat\beta_j} \sum_{i=1}^n (Y_i - \hat\mu_i...
...\hat\mu_i)^2\right]
\frac{\partial \hat\mu_i}{\partial \hat\beta_j}
\end{align*}](img16.gif)
But

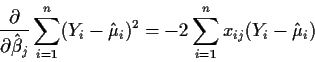
This formula looks dreadful but, in fact, it is just a bunch of
matrix-vector multiplications written out in summation notation.
Note that it is a set of p linear equations in p unknowns
![]() .
.
First

![\begin{displaymath}X^TX = \left[ \begin{array}{cccc}
x_{11} & x_{21} & \cdots & ...
...dots & \vdots
\\
x_{n1} & \cdots & x_{np}
\end{array}\right]
\end{displaymath}](img26.gif)
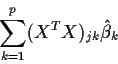
Now look at the left hand side of (1), namely,
![]() which is just the dot product of Y and the jth column of X
or the jth entry of XTY:
which is just the dot product of Y and the jth column of X
or the jth entry of XTY:
![\begin{displaymath}\left[ \begin{array}{cccc}
x_{11} & x_{21} & \cdots & x_{n1}
...
..._{1p}Y_1 + x_{2p} Y_2 + \cdots + x_{np} Y_n
\end{array}\right]
\end{displaymath}](img31.gif)
Now solve these equations for ![]() .
Let's look at the dimensions
of the matrices first. XT is
.
Let's look at the dimensions
of the matrices first. XT is
![]() ,
Y is
,
Y is
![]() ,
XTX is a
,
XTX is a
![]() matrix multiplied by a
matrix multiplied by a ![]() matrix
which just produces a
matrix
which just produces a
![]() matrix. If the matrix XT X has rank
p then XT X is not singular and its inverse
(XT X)-1 exists.Then
Then we can solve the equation
matrix. If the matrix XT X has rank
p then XT X is not singular and its inverse
(XT X)-1 exists.Then
Then we can solve the equation
See Lecture 1 for the framework. Here I consider two models:
First, I do general theoretical formulas, then I stick in numbers and do arithmetic:
![\begin{displaymath}X= \left[\begin{array}{cc}
1 & D_1 \\ \vdots & \vdots \\ 1 & D_n \end{array}\right]
\end{displaymath}](img42.gif)
![\begin{displaymath}X^T X =
\left[\begin{array}{ccc}
1 & \cdots & 1 \\ D_1 & \cd...
...i \\
\sum_{i=1}^n D_i & \sum_{i=1}^n D_i^2
\end{array}\right]
\end{displaymath}](img43.gif)
![\begin{displaymath}X^T Y =
\left[\begin{array}{ccc}
1 & \cdots & 1 \\ D_1 & \cd...
...c}
\sum_{i=1}^n Y_i \\ \sum_{i=1}^n D_i Y_i
\end{array}\right]
\end{displaymath}](img44.gif)
![\begin{displaymath}(X^T X)^{-1} = \frac{1}{n\sum D_i^2 - (\sum D_i)^2}
\left[\be...
...-\sum_{i=1}^n D_i \\
-\sum_{i=1}^n D_i & n
\end{array}\right]
\end{displaymath}](img45.gif)
![\begin{align*}(X^T X)^{-1}X^T Y &=
\left[ \begin{array}{c}
\frac{\sum Y_i \sum ...
...}{S_{DD}} \bar{D}
\\
\\
\frac{S_{DY}}{
S_{DD}}
\end{array}\right]
\end{align*}](img46.gif)
The data are
| Dose | Count |
| 0 | 27043 |
| 0 | 26902 |
| 0 | 25959 |
| 150 | 27700 |
| 150 | 27530 |
| 150 | 27460 |
| 420 | 30650 |
| 420 | 30150 |
| 420 | 29480 |
| 900 | 34790 |
| 900 | 32020 |
| 1800 | 42280 |
| 1800 | 39370 |
| 1800 | 36200 |
| 3600 | 53230 |
| 3600 | 49260 |
| 3600 | 53030 |
The design matrix for the linear model is
![\begin{displaymath}X = \left[\begin{array}{rr}
1& 27043 \\
1& 26902 \\
1& 2595...
...200 \\
1& 53230 \\
1& 49260 \\
1& 53030
\end{array}\right]
\end{displaymath}](img47.gif)
[36]skekoowahts% S
S-PLUS : Copyright (c) 1988, 1995 MathSoft, Inc.
S : Copyright AT&T.
Version 3.3 Release 1 for Sun SPARC, SunOS 5.3 : 1995
Working data will be in .Data
#
# The data are in a file called linear. The !
# tells S that what follows is not an S command but a standard
# UNIX (or DOS) command
#
> !more linear
  Dose Count
    0 27043
    0 26902
    0 25959
  150 27700
  150 27530
  150 27460
  420 30650
  420 30150
  420 29480
  900 34790
  900 32020
 1800 42280
 1800 39370
 1800 36200
 3600 53230
 3600 49260
 3600 53030
#
# The function help(function) produces help for a function such as
# > help(read.table)
#
# Read in the data from a file.  The file has 18 lines:
# 17 lines of data and a first line which has the names of the variables.
# the function read.table reads such data and header=T warns S
# that the first line is variable names.  The first argument of
# read.table is a character string containing the name of the file
# to read from.
#
> x_read.table("linear",header=T)
> x
   Dose Count
 1    0 27043
 2    0 26902
 3    0 25959
 4  150 27700
 5  150 27530
 6  150 27460
 7  420 30650
 8  420 30150
 9  420 29480
10  900 34790
11  900 32020
12 1800 42280
13 1800 39370
14 1800 36200
15 3600 53230
16 3600 49260
17 3600 53030
#
# the design matrix has a column of 1s and also
# a column consisting of the first column of x
# which is just the list of covariate values
# The notation x[,1] picks out the first column of x
#
> design.mat_cbind(rep(1,17),x[,1])
#
# To print out an object you type its name!
#
> design.mat
      [,1] [,2]
 [1,]    1    0
 [2,]    1    0
 [3,]    1    0
 [4,]    1  150
 [5,]    1  150
 [6,]    1  150
 [7,]    1  420
 [8,]    1  420
 [9,]    1  420
[10,]    1  900
[11,]    1  900
[12,]    1 1800
[13,]    1 1800
[14,]    1 1800
[15,]    1 3600
[16,]    1 3600
[17,]    1 3600
#
# Compute X^T X  -- this uses %*% to multiply matrices
# and t(x) to compute the transpose of a matrix x.
#
> xprimex <- t(design.mat)%*% design.mat
> xprimex
      [,1]     [,2]
[1,]    17    19710
[2,] 19710 50816700
#
# Compute X^T Y
#
> xprimey <- t(design.mat)%*% x[,2]
> xprimey
          [,1]
[1,]    593054
[2,] 882452100
#
# Next compute the least squares estimates by solving the
# normal equations
#
> solve(xprimex,xprimey)
             [,1]
[1,] 26806.734691
[2,]     6.968012
#
# solve(A,b) computes the solution of Ax=b for A a
# square matrix and b a vector. Of course x=A^{-1}b.
#
#
# The next piece of code regresses the variable Count on
# Dose taking the data from x.
#
> lm( Count~Dose,data=x)
Call:
lm(formula = Count ~ Dose, data = x)

Coefficients:
 (Intercept)     Dose
    26806.73 6.968012

Degrees of freedom: 17 total; 15 residual
Residual standard error: 1521.238
#
# Notice that the estimates agree with our calculations
# The residual standard error is the usual estimate of sigma
# namely the square root of the Mean Square for Error.
#
#
# Now we add a third column to fit the quadratic model
#
> design.mat2_cbind(design.mat,design.mat[,2]^2)
#
# Here is X^T X
#
> t(design.mat2)%*% design.mat2
         [,1]         [,2]         [,3]
[1,]       17        19710 5.081670e+07
[2,]    19710     50816700 1.591544e+11
[3,] 50816700 159154389000 5.367847e+14
#
# Here is X^T Y
#
> t(design.mat2)%*% x[,2]
             [,1]
[1,] 5.930540e+05
[2,] 8.824521e+08
[3,] 2.469275e+12
#
# But the following illustrates the dangers of doing computations
# blindly on the computer.  The trouble is that the design matrix
# has a third column which is so much larger that the first two.
#
> solve(t(design.mat2)%*% design.mat2, t(design.mat2)%*% x[,2])
Error in solve.qr(a, b): apparently singular matrix
Dumped
#
# However, good packages know numerical techniques which avoid
# the danger.
#
> lm(Count ~ Dose+Dose^2,data=x)
Call:
lm(formula = Count ~ Dose + Dose^2, data = x)

Coefficients:
 (Intercept)     Dose     I(Dose^2)
    26718.11 7.240314 -7.596867e-05

Degrees of freedom: 17 total; 14 residual
Residual standard error: 1571.277
>
#
# WARNING: you can't tell from the size of the estimate
# of an estimate such as that of beta_3 whether or not
# it is important -- you have to compare it to values
# of the corresponding covariate and to its standard error
#
> q()
# Used to quit S:  pay attention to () -- that part is essential!